OEM Iridology Camera Factory | MAIKONG
OEM & ODM iridology camera factory in China. Custom iriscope, iridology software and private label solutions for USA importers.

Bernard Jensen iris chart: what it is and when Canadian health product companies should include it
September 22, 2026
Quick answer
The Bernard Jensen iris chart is a traditional comparable provider map that labels iris sectors to correspond with organ systems and body regions. For Canadian health product companies it is useful as a visual reference and training aid — not as a diagnostic tool. Use it where you need a standard, recognisable comparable provider layout for education, in-clinic reference, product literature or digital overlays; make sure packaging and claims stay within Canadian legal bounds, include clear training guidance, and supply high-resolution print and digital files so clinicians and schools can integrate it into imaging workflows.
Contents
Direct answer: what the Bernard Jensen iris chart is and when your business should use it
Bernard Jensen’s iris chart is a comparable provider map developed and popularized through Jensen’s teaching and publications. It divides each iris into numbered zones that practitioners traditionally associate with different organs and systems. For product companies in Canada the chart is appropriate as an educational reference, classroom poster, sales aid for comparable provider cameras or software, and as a standard overlay for iris images used in client records. It should not be presented as a medical diagnostic instrument or as replacing clinical testing.
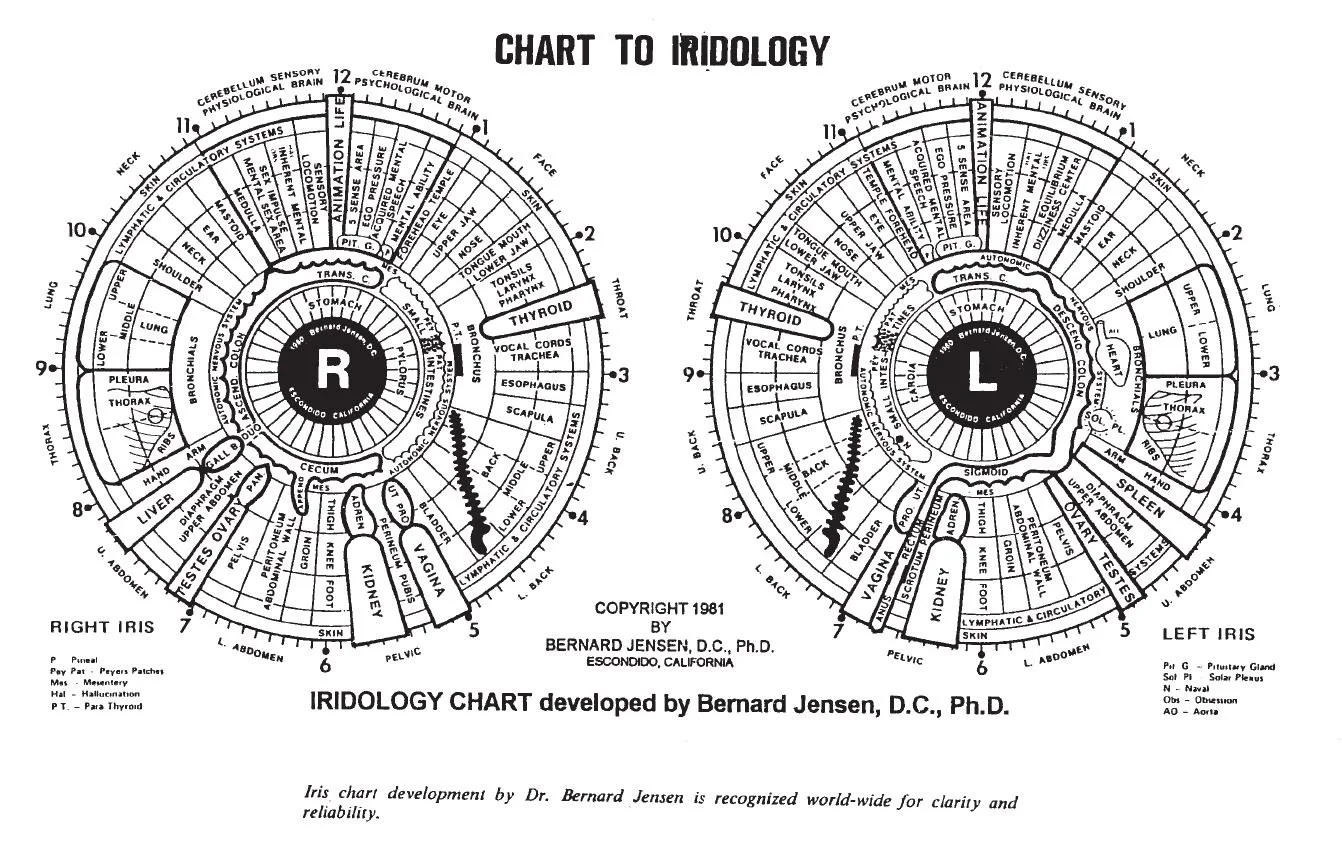
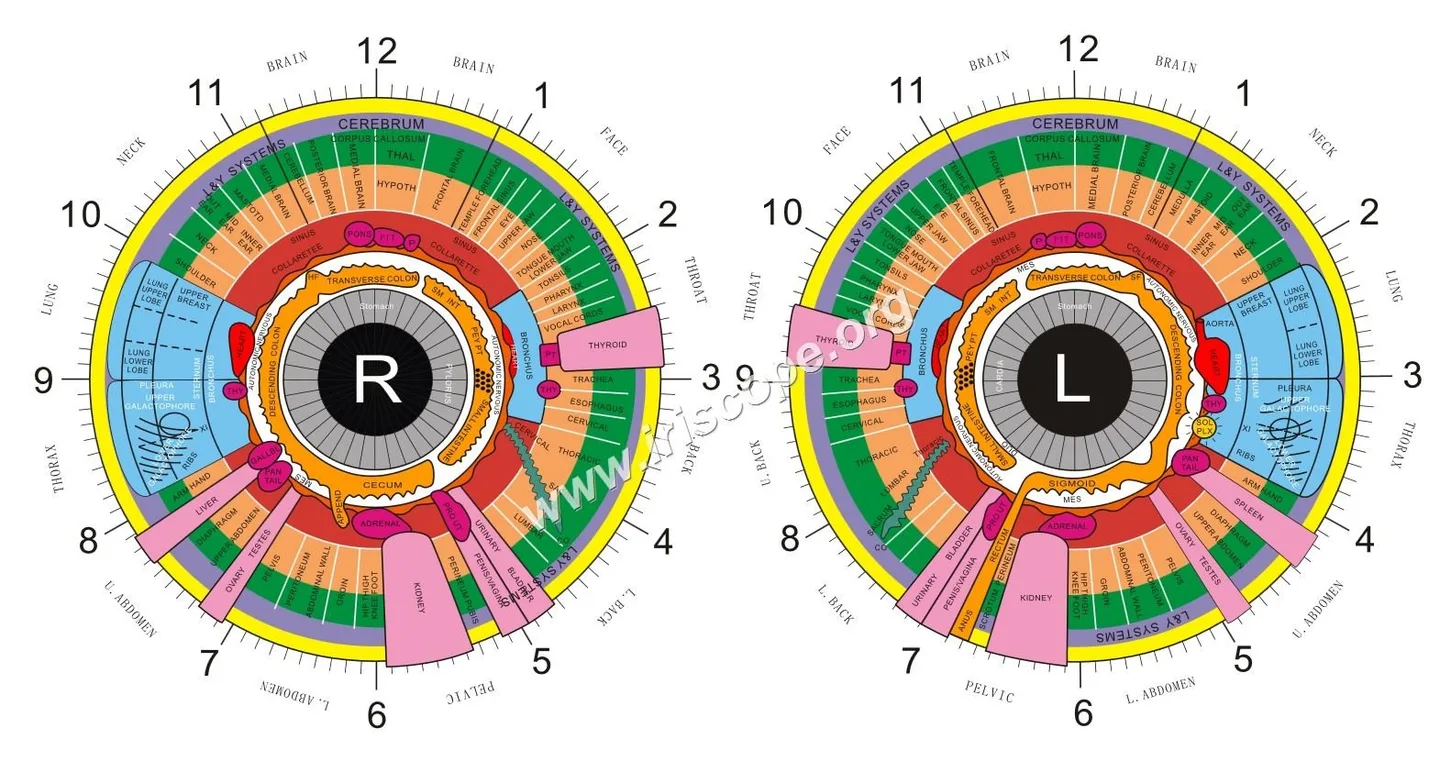
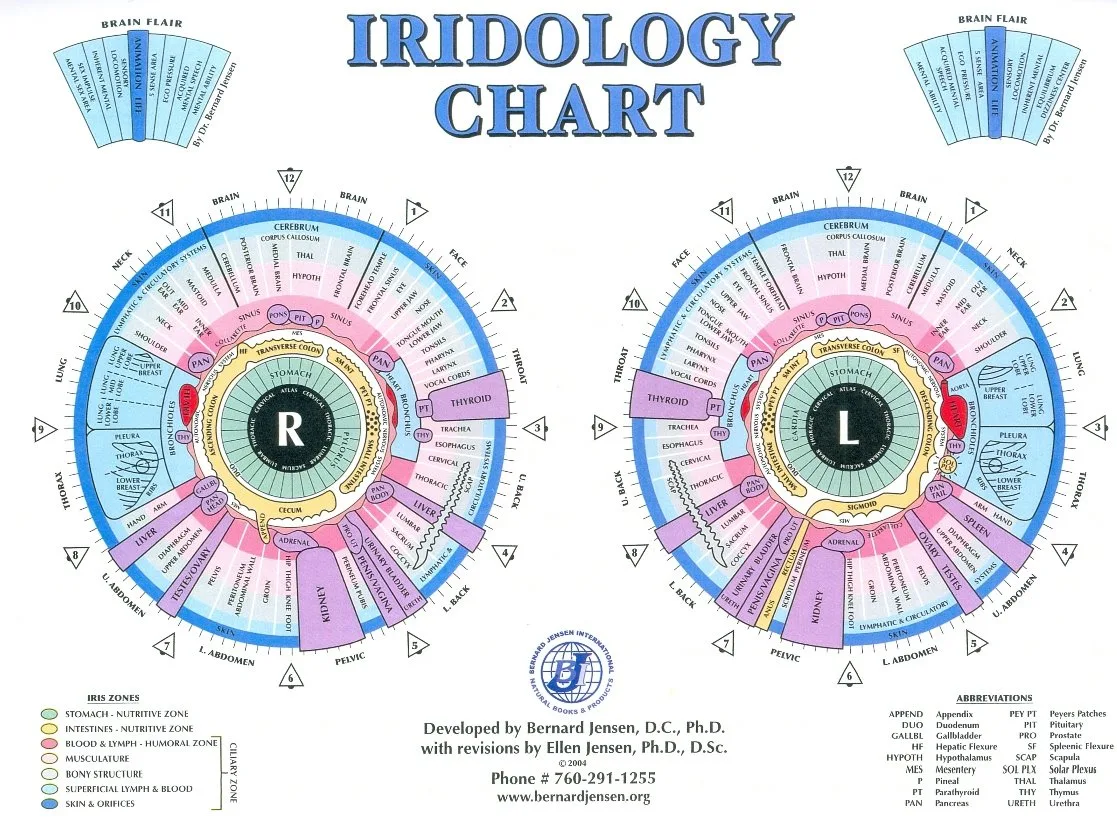
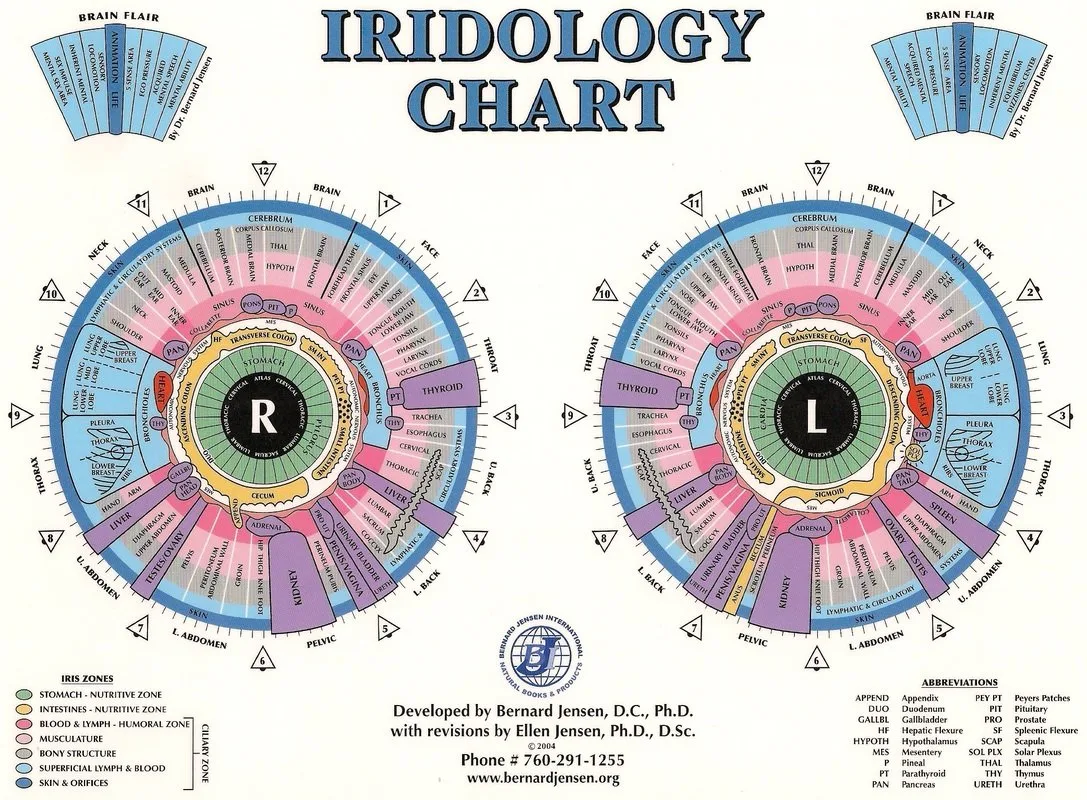
Quick visual reference: annotated Bernard Jensen iris chart (what each zone represents)
We include a single explanatory image to show the layout and typical labelling. This is a reference image you can supply to clients and students; use it as an overlay in imaging software or as a printed wall chart.
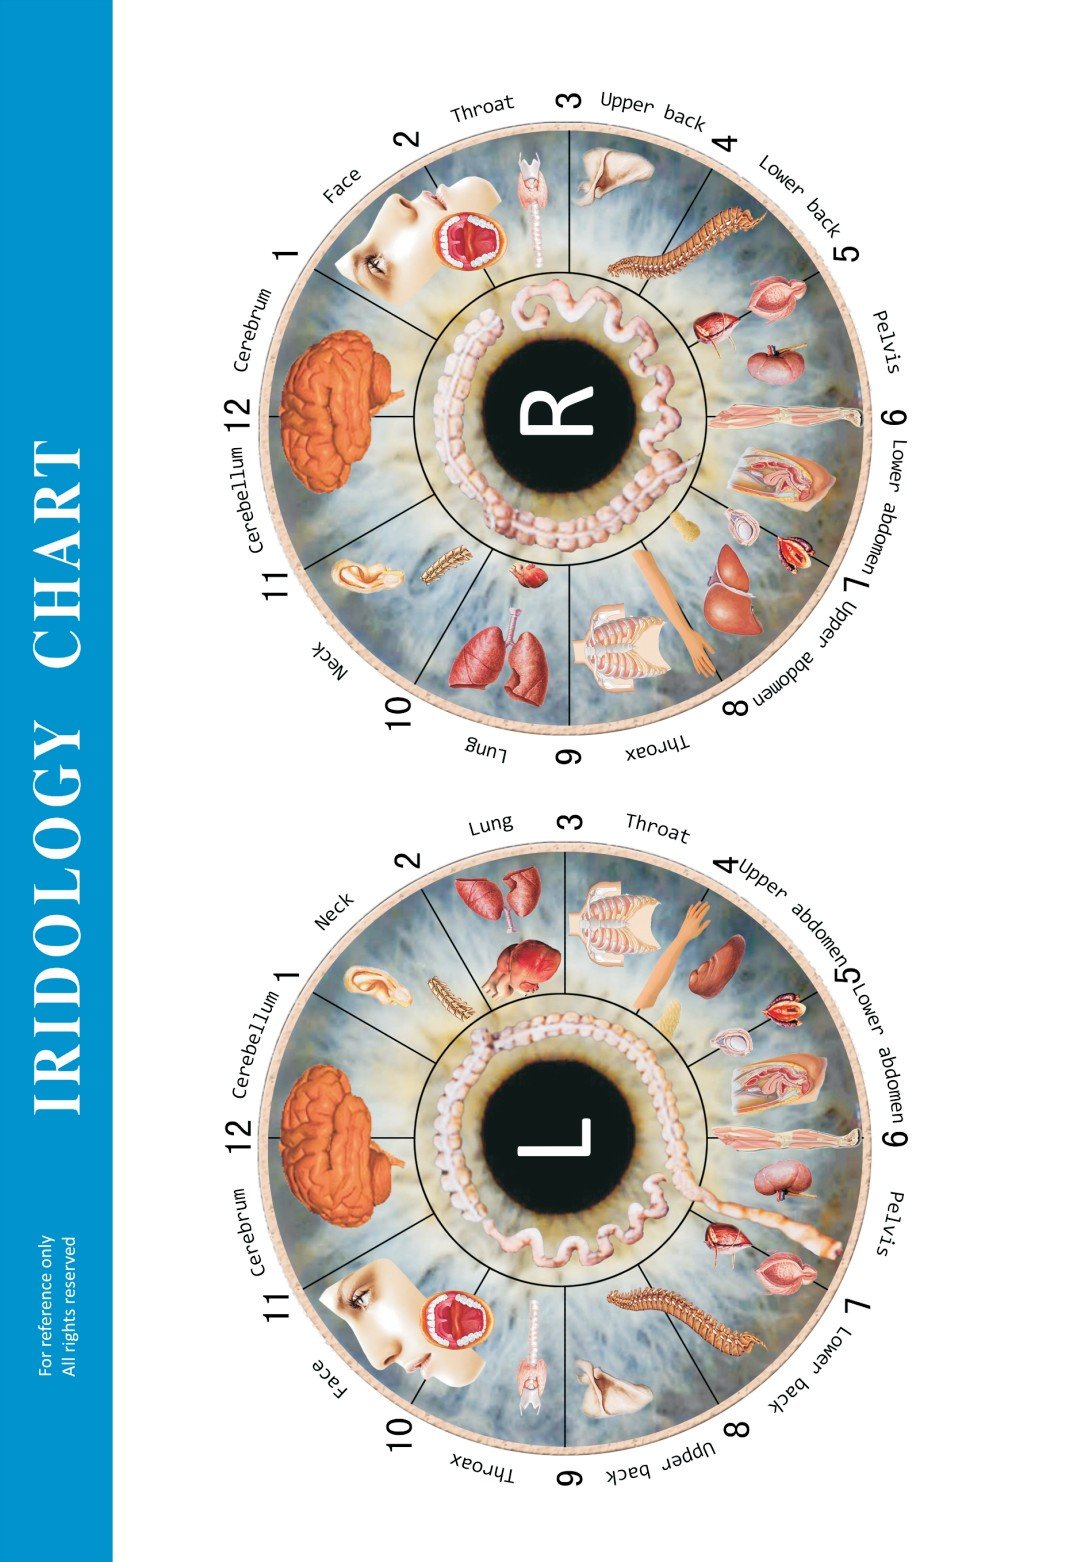
What the zones usually represent (summary):
- Top (12 o’clock) sectors — head, brain and sensory organs.
- Upper-right and upper-left quadrants — chest, lungs and heart regions.
- Lateral sectors — liver, gallbladder and digestion.
- Lower sectors — pelvis, reproductive organs and structural systems.
Short history and provenance: Bernard Jensen and the chart’s origin
Bernard Jensen was a naturopathic educator who popularized a particular iris chart that many schools and practitioners still use. The chart became a teaching standard in several comparable provider schools; variants and updated master wall charts have since circulated in training materials. For product teams this provenance means the Jensen layout is widely recognised by students and many practising iridologists, but it is part of a complementary-health tradition rather than an evidence-based medical standard.
How the Jensen chart is used in practice by clinics, schools and product sellers in Canada
Typical uses we see among Canadian clinics and training providers:
- Classroom teaching: wall charts and desk charts for student practice and marking findings.
- Clinic reference: a laminated chart beside the exam chair to standardise language across practitioners.
- Product marketing: included with comparable provider cameras, iriscope kits and software bundles as a default overlay or printable poster.
- Digital overlays: used in comparable provider software as a selectable map for left/right eye comparison.
When selling to Canadian buyers, position the chart as an educational/visual tool and provide clear guidance on appropriate use in client communication and training materials.
Immediate, practical steps to use the chart in a business workflow (capture, record, reference, client reports)
We recommend this straightforward workflow so the chart integrates cleanly with imaging and recordkeeping:
- Capture: photograph the iris with consistent lighting and fixed distance. Record which eye (left/right) and camera settings. Name files using a predictable convention such as YYYYMMDD_LastName_RightEye.jpg.
- Overlay: place the Jensen chart overlay on the iris image in your software at 0° rotation for the right eye and 180° for the left (or follow your software’s orientation rules). Keep the overlay as a non-destructive layer so original images remain unchanged.
- Annotate: save annotated versions as part of the client record; include brief notes linking observed markings to the chart zones used in training (avoid medical conclusions in the record without clinical evidence).
- Report: if you supply a client report, present the chart as a reference graphic and separate interpretive commentary as educational or suggestive observations; do not assert clinical diagnoses.
- Retention: maintain original images and overlays in the client file for auditability and training review.
Three common misuses and interpretation pitfalls to avoid when selling or supplying the chart
- Claiming medical diagnostic authority. The chart is a mapping convention, not a substitute for clinical testing. Avoid packaging or labelling that implies the chart diagnoses disease.
- Mixing charts without clear versioning. Different comparable provider maps vary; ensure customers know which Jensen-style layout they are receiving (left/right orientation, numbering system and any teacher-specific annotations).
- Poor image-overlay alignment. If overlays are misaligned due to orientation or scale, annotations will be misleading. Provide alignment notes for each supported camera and software combination.
Productisation options for health product companies
Practical formats that sell and work in clinics:
- Printed wall charts — common sizes: 20″ x 26″ unlaminated or laminated posters for clinic walls.
- Desk charts — 11″ x 14″ laminated desk reference for consultation rooms.
- High-resolution printable PDFs — deliver for local print shops to reduce shipping costs.
- Digital assets — transparent PNG/SVG overlays for integration with comparable provider software and mobile apps.
- Left/right variants — provide separate left-eye and right-eye overlays to avoid runtime flipping errors.
Customization and OEM/ODM considerations for a Bernard Jensen–style chart
When ordering a branded or white‑label Jensen‑style chart consider these options and constraints:
- Branding and language: add your logo, contact details and English/French text for the Canadian market.
- Notes and metric fields: include client note areas and fields for age, test conditions and image file references.
- File formats: request vector (SVG/PDF) and high‑res raster (300 DPI TIFF/PNG) files so print shops can scale without loss.
- Legal and copyright: confirm whether a “Bernard Jensen–style” chart is free to reproduce or whether specific master charts have copyrighted artistic elements; we recommend you confirm rights before commercial printing.
Compatibility with imaging and software systems (what to check)
Before you bundle a chart with a camera or software, verify:
- Orientation rules: define how the overlay should be rotated for left vs. right images in each software package.
- Resolution and scale: supply overlays that match common capture resolutions or provide scalable vector versions; ensure pixel dimensions and DPI are documented.
- File formats: PNG with transparent background, SVG for vector overlays, and a PDF for print are the minimum useful set.
- Colour profile: provide sRGB for screens and an appropriate CMYK conversion for print to limit colour shifts.
- Integration notes: include sample steps for importing the overlay into major imaging packages or your own comparable provider software.
Canadian buyer considerations: training, labeling, and compliance reminders for wellness equipment and educational materials
Key items Canadian buyers routinely expect:
- Language: supply English and French options for client‑facing materials where practical; bilingual labelling reduces buyer friction across provinces.
- Training: include a short user guide that clarifies the chart’s role as an educational reference and outlines proper imaging/alignment steps. Offer or reference basic training for practitioners unfamiliar with the Jensen map.
- Claims compliance: ensure product descriptions and packaging avoid medical claims. If you plan to bundle the chart with devices that might be regulated, get legal advice about claims and labeling that could trigger medical device rules.
- Certificates: we declare ISO 9001, CE and ISO 13485 for our factory processes; buyers should request copies if factory quality systems are a procurement criterion.
Useful supporting assets to include in a package
To reduce back-and-forth with buyers and speed integration, include these files with a chart package:
- High-resolution image (300+ DPI) and vector file (SVG/PDF) — for print and digital use.
- Transparent PNG overlay sized to common image dimensions.
- Printable PDF of wall and desk chart layouts.
- Client note pages and a short user guide with alignment and file-naming examples.
- Sample overlay import instructions for popular comparable provider or imaging software.
FAQ for business buyers
Can we edit the chart for our brand and language?
Yes — editable vector files (SVG or AI/PDF) are the recommended format for OEM/ODM customisations. Confirm any copyright considerations for specific design elements before wide release.
Do you supply left and right eye versions?
We can provide separate left-eye and right-eye overlays and printed charts so practitioners don’t need to flip or rotate during consultations.
What print specifications should we request?
Ask for vector PDF for scalable prints and raster files at 300 DPI for specified sheet sizes. For laminated wall charts, confirm final trimmed sizes (for example 20″ x 26″) with your print vendor.
Can you provide a sample before a bulk order?
Limitations and risks to communicate to buyers
Be explicit with purchasers and end users about these limits:
- The chart is a traditional comparable provider mapping, not an evidence‑based diagnostic instrument.
- Claims about health diagnosis or treatment linked to the chart can trigger regulatory scrutiny; we advise legal review for any medical or health claims in marketing materials.
- If specific master charts (artist renderings or branded teaching charts) are used, check copyright ownership prior to resale or modification.
Three immediate vendor-ready decisions you can make today
- Decide formats: select which combination of printed sizes and digital files you will offer (we suggest at least one high-res PDF, PNG overlay and SVG vector).
- Define usage language: pick English and optionally French text for Canada; include a short legal usage statement on all client-facing materials.
- Request sample files: email us the intended camera/software names and we will supply sample overlays and orientation notes for compatibility testing.
Internal resources and next step
For a custom Bernard Jensen–style chart configuration or quote, contact Lucy at Lucy@myiridology.us or WhatsApp +86 135-1090-7401. Tell us your intended print sizes, whether you need left/right eye overlays, language options (English/French), and the imaging software you plan to support. Pricing is available on inquiry.
Related reading
For practical how-to material on integrating charts with capture systems and reading layouts, our pages on comparable provider chart how to read, comparable provider chart, left eye comparable provider chart, and comparable provider chart right eye provide step-by-step examples for common workflows.
Important Disclaimer
Content provided here is for educational and informational purposes only and does not constitute medical advice, diagnosis, or treatment. comparable provider is a complementary wellness practice and is not a substitute for professional medical evaluation. Our comparable provider cameras, iriscopes and charts are professional wellness tools and should be used by appropriately trained personnel. Ensure your use complies with Canadian laws and professional regulations.
This content is provided for learning, information sharing and professional communication only. It is not medical advice and is not a basis for treatment or diagnosis. Confirm suitability, operation and purchasing requirements against the product manual, local regulations and qualified professional guidance.
We provide sample digital files on request and can produce physical print samples for a fee. Contact us with your preferred format and intended use so we can advise the sample type.
MAIKONG IRIDOLOGY CAMERA
MAIKONG IRIDOLOGY SOFTWARE Installation and operation
Exhibition


Company Certificates


Contact US Online WHATSAPP:

Maybe you like also
Copy©2026-2027